
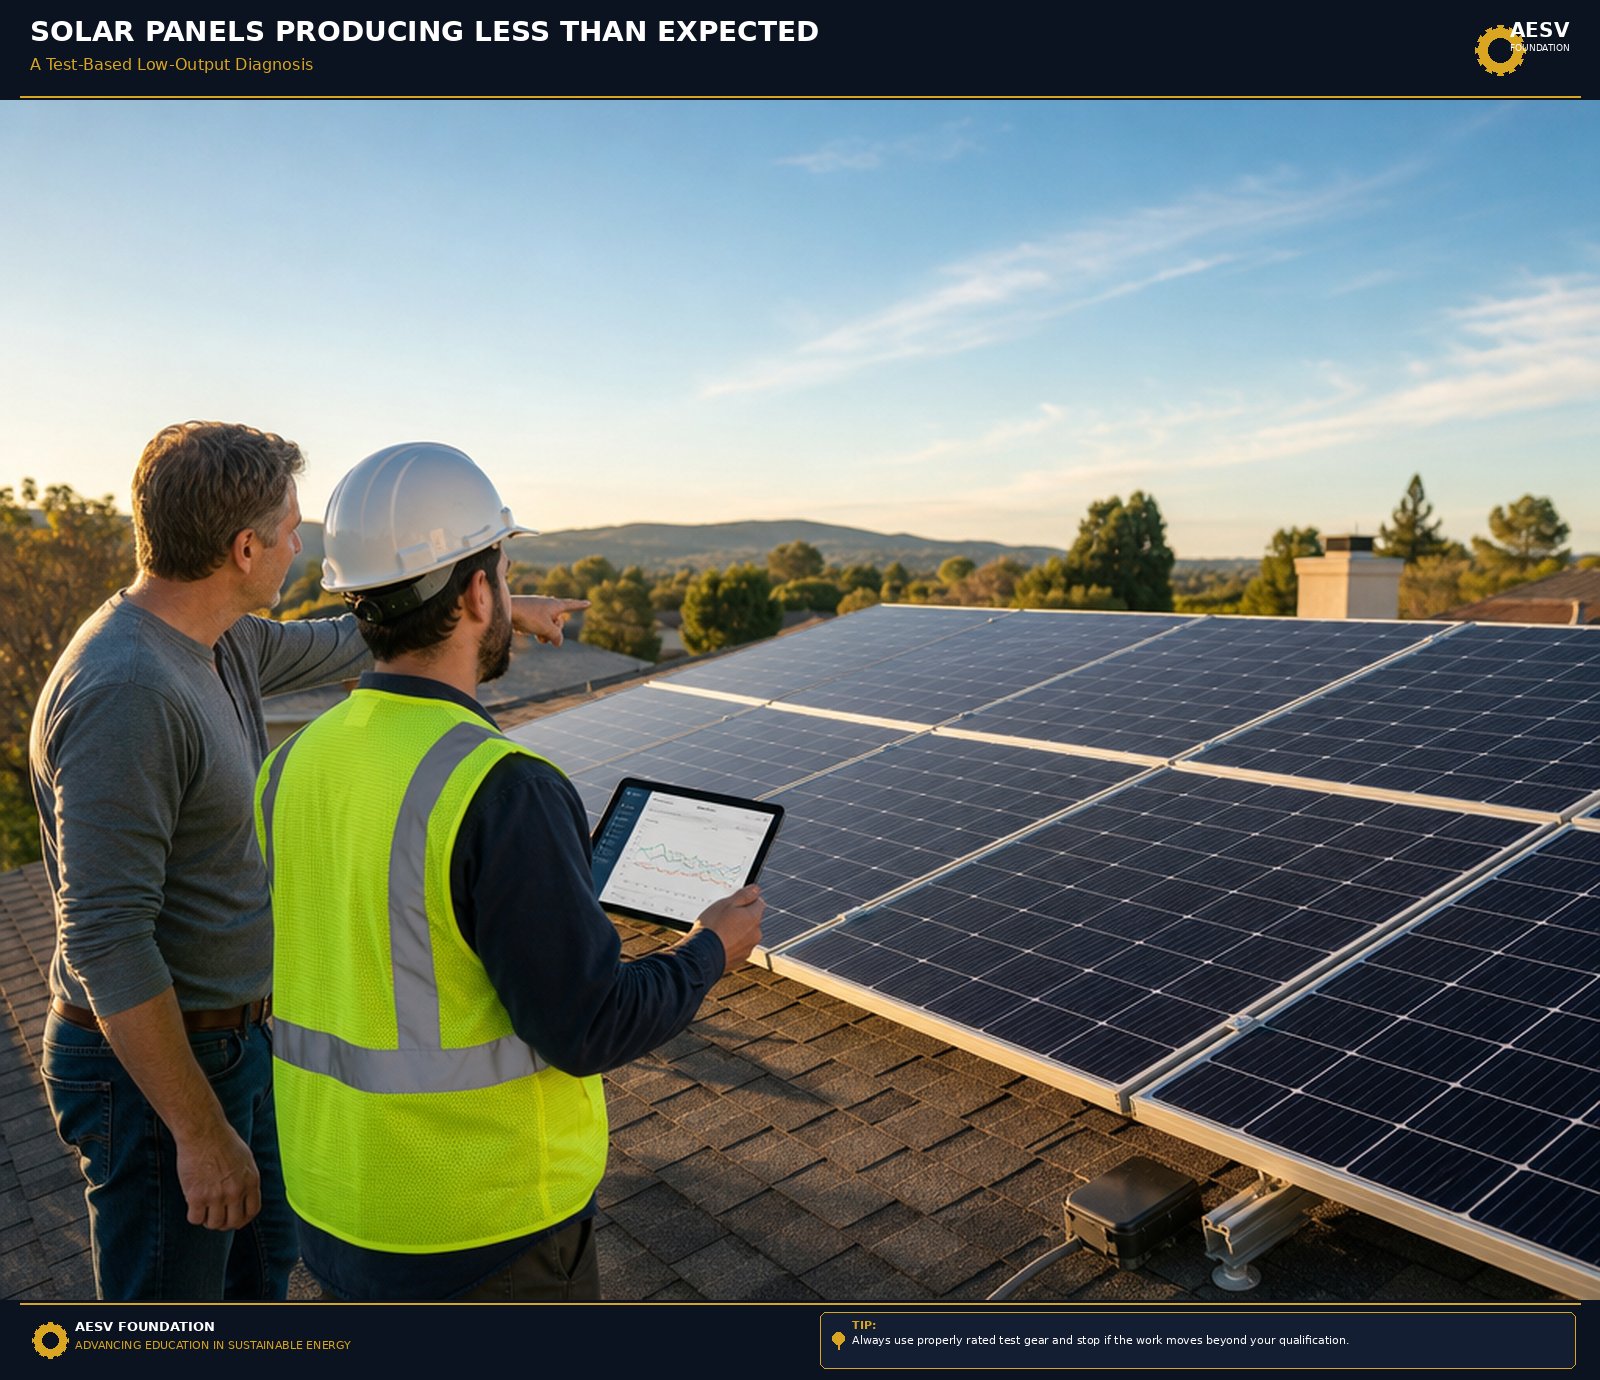
If your array is making less power than you expected, the first question is not “which part should I replace?” It is “is this a real fault, or just a normal field condition?” Solar output changes with weather, temperature, shading, soiling, and the assumptions built into any expected-output model, so a useful diagnosis starts by comparing measured performance against a realistic baseline.[1][2][3]
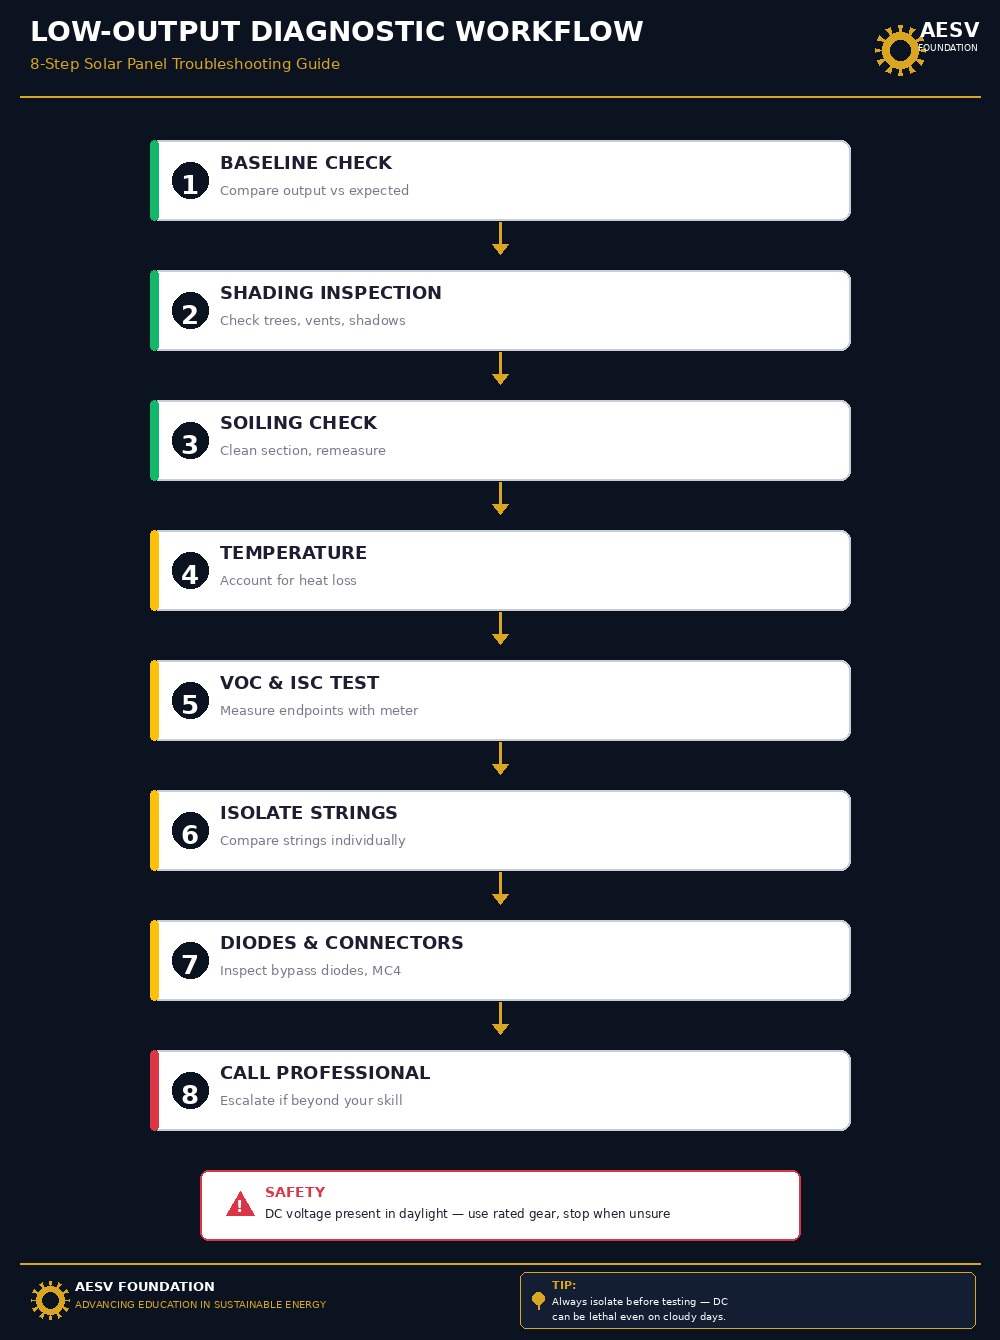
This guide uses an ordered workflow for low-output diagnosis: establish the baseline, check for shading and soiling, account for temperature, compare Voc and Isc readings, isolate strings, and then inspect bypass diodes and MC4 connectors where the evidence points.[4][5][6][7][8][9][10]
Normal versus fault
A lower-than-nameplate result is not automatically a failure. Lab ratings are taken under standard test conditions, while real roofs and ground mounts operate under changing irradiance, temperature, and scene conditions.[3] PVWatts is useful for a quick expectation check, but it also carries inherent assumptions and uncertainties, so it should be treated as a screening tool rather than a perfect field model.[1]
| Observation | Often normal | More suspicious | Best next check |
|---|---|---|---|
| Output is lower on hot afternoons | Module temperature is higher and production falls | Loss is larger than the weather can explain | Compare against expected output and temperature-adjusted behavior |
| Output drops only when nearby shade appears | Shade from trees, vents, or chimneys is affecting the array | Loss remains after the shade is gone | Inspect the shade pattern and retest in clear sun |
| Output improved after cleaning | Soiling was the main cause | Cleaning made little or no difference | Move to electrical testing and string checks |
| One string is weaker than the others | All strings behave similarly | One string has a persistent mismatch | Isolate strings and compare Voc/Isc readings |
The table above is a practical triage tool, not a final diagnosis. The point is to separate field variation from a fault path before you spend money on parts or schedule invasive work.[1][3][6]
Ordered diagnostic workflow
Start with the least invasive checks and move toward electrical testing only after you have ruled out the obvious causes. That sequence reduces risk and keeps you from mistaking a predictable weather or site effect for a hardware problem.[1][2][6]
- Confirm the problem against a realistic baseline. Compare today’s output with yesterday’s trend, the inverter or monitoring portal, and an expected-output estimate.
- Inspect the array for shading. New shade from trees, antennas, vents, debris, or seasonal sun-angle changes can cut output quickly.
- Inspect for soiling. Dust, pollen, bird droppings, and residue can create a measurable power loss even when the modules still look “mostly clean.”
- Account for temperature and irradiance. Hot modules produce less power, and low irradiance changes what you should expect from Voc, Isc, and power output.
- Measure Voc and Isc only with the correct meter, lead rating, and procedure. These endpoint checks are useful, but they do not tell the full story.
- Isolate strings one at a time when the system layout allows it. A weak string often becomes obvious when it is compared with a stronger sibling under the same weather.
- Look for bypass-diode behavior and connector problems if the curve or string behavior points that way.
- Stop and escalate if the fault path suggests damaged insulation, overheated connectors, or a condition you are not trained to service.
If you want a quick planning check before going deeper, use the AESV calculator to turn appliance loads into daily watt-hours, battery capacity, and panel capacity for backup/load planning. It is not a PVWatts-style actual-versus-expected production comparison tool.[1][3]
Shading
Shading is one of the fastest ways to make a healthy-looking array underperform. NREL’s shading work shows that shade and mismatch occur across many PV installations, and that even small shadow patterns can lead to disproportionate power loss because bypass diodes change how the string carries current.[4]
That is why the location, shape, and timing of the shade matter. A morning shadow from a chimney, a midday shadow from a vent, and a late-day shadow from a tree can all produce different output patterns. If output drops only when the shade appears and recovers when the shade disappears, shading is a stronger explanation than module failure.[4][6]
Shading also changes the shape of the I-V curve. In practice, that is useful because a curve with steps or notches often points to bypass-diode activity rather than a simple “bad panel.”[4][6]
Soiling
Soiling means dirt, dust, pollen, droppings, or other contamination that blocks sunlight from reaching the cells. DOE and NREL both treat soiling as a real field loss factor, alongside temperature and shading, because it reduces the energy yield you actually harvest from the array.[2][5]
The key diagnostic question is not “is there any dirt?” but “is the amount of soiling enough to explain the output drop?” That is why it helps to clean a representative section, remeasure, and compare the change against the rest of the array.[5][6]
If cleaning produces a noticeable recovery, you likely found at least part of the problem. If cleaning changes little, move on to electrical checks instead of repeatedly washing the modules.[5][6]
Temperature
Hotter modules usually make less power than cooler modules. DOE’s performance material notes that PV output under field conditions is affected by solar resource, temperature, and age, and that STC ratings are taken at 1,000 W/m² and 25°C cell temperature rather than real-world conditions.[3]
That matters because a homeowner may see a “low” reading on a hot day that is actually a normal temperature effect. Temperature alone does not prove a fault. The useful question is whether the drop is larger than expected after you account for temperature and weather together.[1][3]
When you compare actual output to expected output, do not ignore temperature. A baseline that ignores heat will overstate how much power the system should be making, which can make a healthy array look broken.[1][2][3]
Voc and Isc
Voc and Isc are useful endpoint checks, but they are not a complete health report. Fluke’s comparison of I-V tracing versus Voc/Isc testing is explicit: Voc and Isc tell you the endpoints of the curve, while I-V tracing shows how the module behaves across its operating range and can reveal shading, soiling, bypass-diode behavior, wiring faults, and degradation patterns that endpoint checks can miss.[6][7]
Use Voc and Isc as screening tools. If they are off, you have a clue. If they look normal, you still may have a problem that only shows up under load, at the wrong string, or at a specific time of day.[6][7][8]
That is why the best practice is to compare the measured values with manufacturer expectations or a field-corrected curve, not with a guess. The point is to answer a simple question: does the array behave like a healthy one under the same conditions?[6][8]
String isolation
If the system has more than one string, compare them. A weak string that looks normal at the inverter can become obvious when you isolate it and test each string on its own. Fluke’s solar testing guidance notes that IEC 62446-1 category tests include Voc, Isc, insulation resistance, polarity, and I-V tracing, and that the SMFT-1000 can short-circuit the positive and negative of a string before testing to ground.[8][9]
That isolation step is useful because it separates a string problem from a system-wide issue. If one string is consistently weaker, the evidence points toward mismatch, damage, a bad connector, or a string-level electrical fault instead of a general weather effect.[6][8][9]
Do not use string isolation as a casual DIY move. It is a diagnostic method for qualified people with the right procedure, because the conductors can still carry hazardous DC energy in daylight.[8][9][10]
Bypass diodes and MC4 connectors
Bypass diodes are part of why a partially shaded module may keep producing, but with a reduced or stepped curve. NREL’s shading material shows that a shaded cell can trigger bypass-diode behavior and remove a substring from the string’s effective output.[4]
That is also why connector problems belong in the same diagnostic branch. Fluke’s I-V guidance lists shorted bypass diodes, wiring faults, and degradation among the issues that can appear as curve deviations, while Enphase’s installation guide reminds installers that MC4 compatibility and correct mating matter for safe operation.[6][7][10]
If the array shows a suspicious step, repeated dropouts, or a single string that stays weak after shading and soiling are ruled out, move connector inspection and diode-related troubleshooting higher on the list.[4][6][7][10]
Safety
Solar troubleshooting is electrical work, not just mechanical inspection. In daylight, DC voltage can still be present on module and string conductors, and the wrong test sequence can create shock, arc, or equipment-damage risk. Fluke’s solar safety material treats insulation resistance testing, open-circuit voltage, short-circuit current, and polarity checks as part of a controlled safety workflow.[8][9]
The practical rule is simple: use properly rated test gear, isolate what must be isolated, and stop when the work moves beyond what you are qualified to do. If you suspect damaged insulation, overheated connectors, water ingress, or internal module damage, the right answer is to pause and hand the case to a qualified solar electrician.[8][9][10]
FAQ
Why is output lower on hot days?
Because hotter modules usually produce less power. Temperature is a normal field loss factor, so a hot day can look disappointing even when the array is working correctly.[2][3]
Can cleaning fix low output?
Yes, if soiling is the main cause. If cleaning changes very little, the problem may be shading, a string issue, a connector issue, or another electrical fault.[5][6]
Is Voc enough to diagnose the problem?
No. Voc and Isc are useful checks, but they only sample the ends of the I-V curve. I-V tracing gives a fuller diagnosis when the issue is load-related, shading-related, or string-specific.[6][7][8]
When should I stop and call a solar professional?
Stop when you suspect damaged insulation, overheated connectors, module internals, or any test step you are not trained to perform safely. That is especially true when the system is still energized in daylight.[8][9][10]
Close
If you need to size backup power from the load side, use AESV’s Solar Backup & Battery Sizing Calculator to turn appliance loads into kWh, then translate that result into battery capacity and panel sizing before you choose hardware. That keeps the next step aligned with backup planning instead of PVWatts-style production comparison.[1][3][6]
Continue with AESV’s guides to solar inverter error codes, solar charge controller troubleshooting, fast-draining solar batteries, or the effect of temperature on solar panel efficiency when those symptoms match your system.
Sources
- [1] https://pvwatts.nrel.gov
- [2] https://www.energy.gov/cmei/systems/photovoltaic-system-design-and-energy-yield
- [3] https://www.energy.gov/sites/default/files/2022-02/understanding-solar-photo-voltaic-system-performance.pdf
- [4] https://www.nrel.gov/docs/fy10osti/49504.pdf
- [5] https://www.nrel.gov/docs/fy22osti/83486.pdf
- [6] https://www.fluke.com/en/learn/blog/renewable-energy/analyze-iv-curves
- [7] https://www.fluke.com/en/learn/blog/renewable-energy/comparing-i-v-curve-tracing-to-circuit-testing-solar-modules
- [8] https://www.fluke.com/en-us/product/electrical-testing/best-solar-energy-industry-tools/smft-1000-pv-tester
- [9] https://www.fluke.com/en/learn/blog/renewable-energy/insulation-resistance-testing-in-solar
- [10] https://enphase.com/en-gb/download/iq8mc-iq8ac-iq8hc-and-iq8x-microinverters-quick-install-guide
